San Francisco Bay Area Traffic: Rush Hours, Bay Bridge & How to Beat Congestion
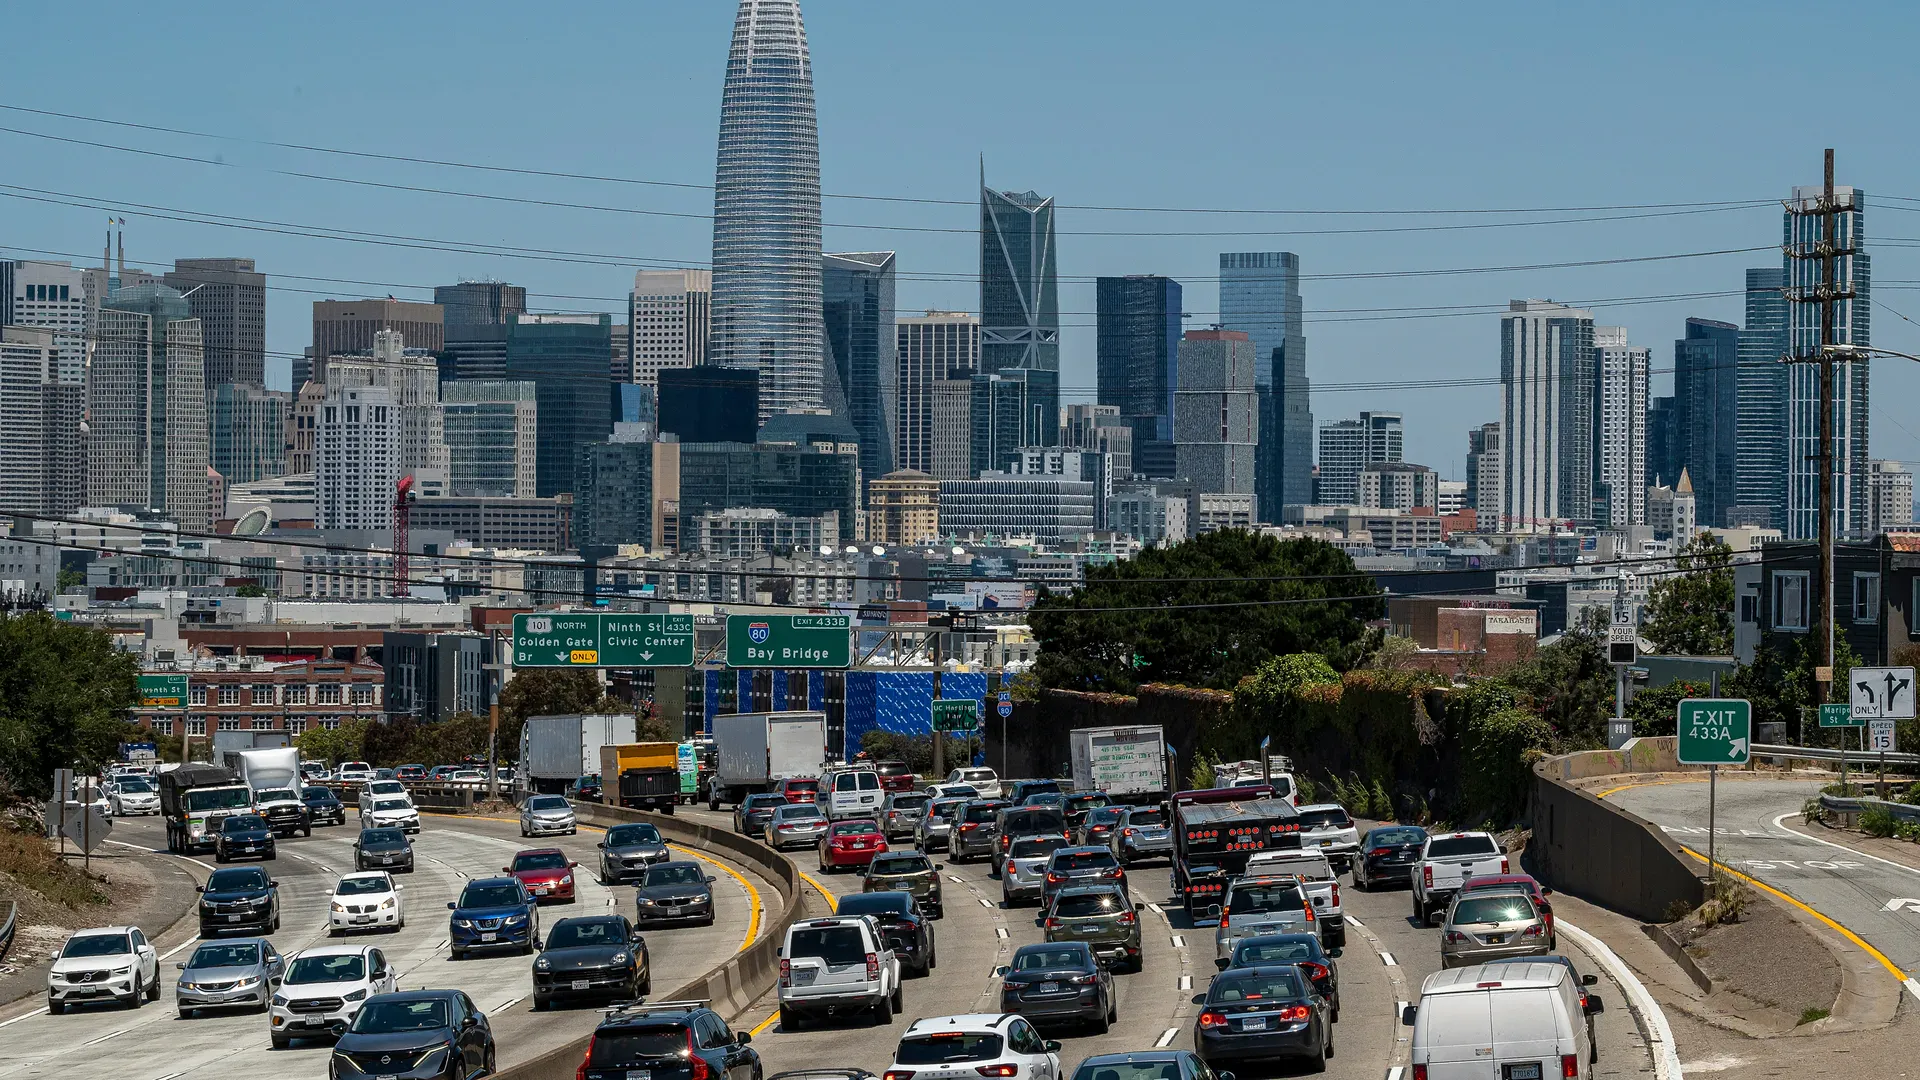
The San Francisco Bay Area is one of the most congested metro areas in the United States. Its geography — water on three sides, a peninsula, and mountain corridors — creates structural bottlenecks that no amount of lane-adding fully resolves. The Bay Bridge, Golden Gate, and Caldecott Tunnel funnel millions of commuters through choke points that operate at capacity for hours each day.
This guide covers when Bay Area traffic is worst, which corridors to watch, and the specific time windows where drive times drop significantly.
San Francisco Bay Area Rush Hour Times
Bay Area traffic is directional in a way few cities match: morning flow is strongly inbound toward San Francisco and Silicon Valley; evening flow reverses toward the East Bay, Peninsula, and Marin. Knowing which direction you're traveling often matters more than the specific time — driving against the primary commute flow can mean moving freely while the opposite lanes are stopped.
Friday afternoons are consistently worse than other weekdays. The evening peak starts an hour earlier and lasts longer, particularly on the Bay Bridge eastbound and on 101 south toward San Jose.
Bay Area's Most Congested Corridors
Six corridors account for the majority of severe, recurring delay in the Bay Area.
| Corridor | Severity | Worst Segment | Peak Direction |
|---|---|---|---|
| Bay Bridge (I-80) | Critical | Oakland approach to toll plaza | WB mornings, EB evenings |
| US-101 (Peninsula) | Critical | San Mateo to San Jose | NB mornings, SB evenings |
| Hwy 24 / Caldecott Tunnel | Critical | Orinda to Oakland | WB mornings, EB evenings |
| I-880 (Nimitz Fwy) | High | Fremont to Oakland | NB mornings, SB evenings |
| I-680 (Sunol Grade) | High | Pleasanton to Fremont | NB mornings, SB evenings |
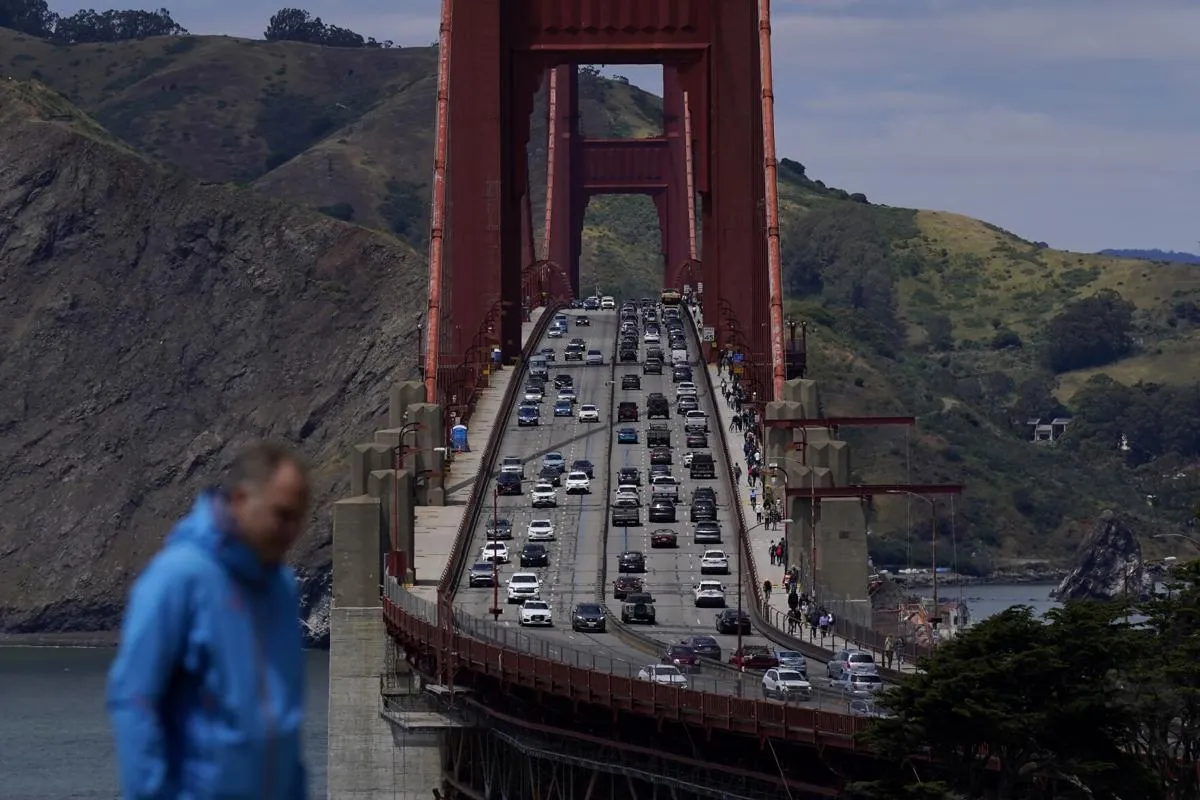
| Golden Gate Bridge (US-101) | Moderate | Marin approach to SF | SB mornings, NB evenings |
The Bay Bridge metering lights compound the bottleneck problem. During peak periods, Caltrans activates ramp meters on the I-80 approach, queuing cars before they even reach the toll plaza. The backup can extend several miles into Oakland. If you're crossing the Bay in the morning, the difference between 6:45 AM and 7:45 AM is often 30–45 minutes.
The Caldecott Tunnel (Hwy 24) is unique in that it reverses its contraflow bore direction based on peak flow — still, the peak-direction backup at the Orinda portal is one of the most reliable slowdowns in the East Bay.
Traffic Hot Spots by Region
San Francisco (City)
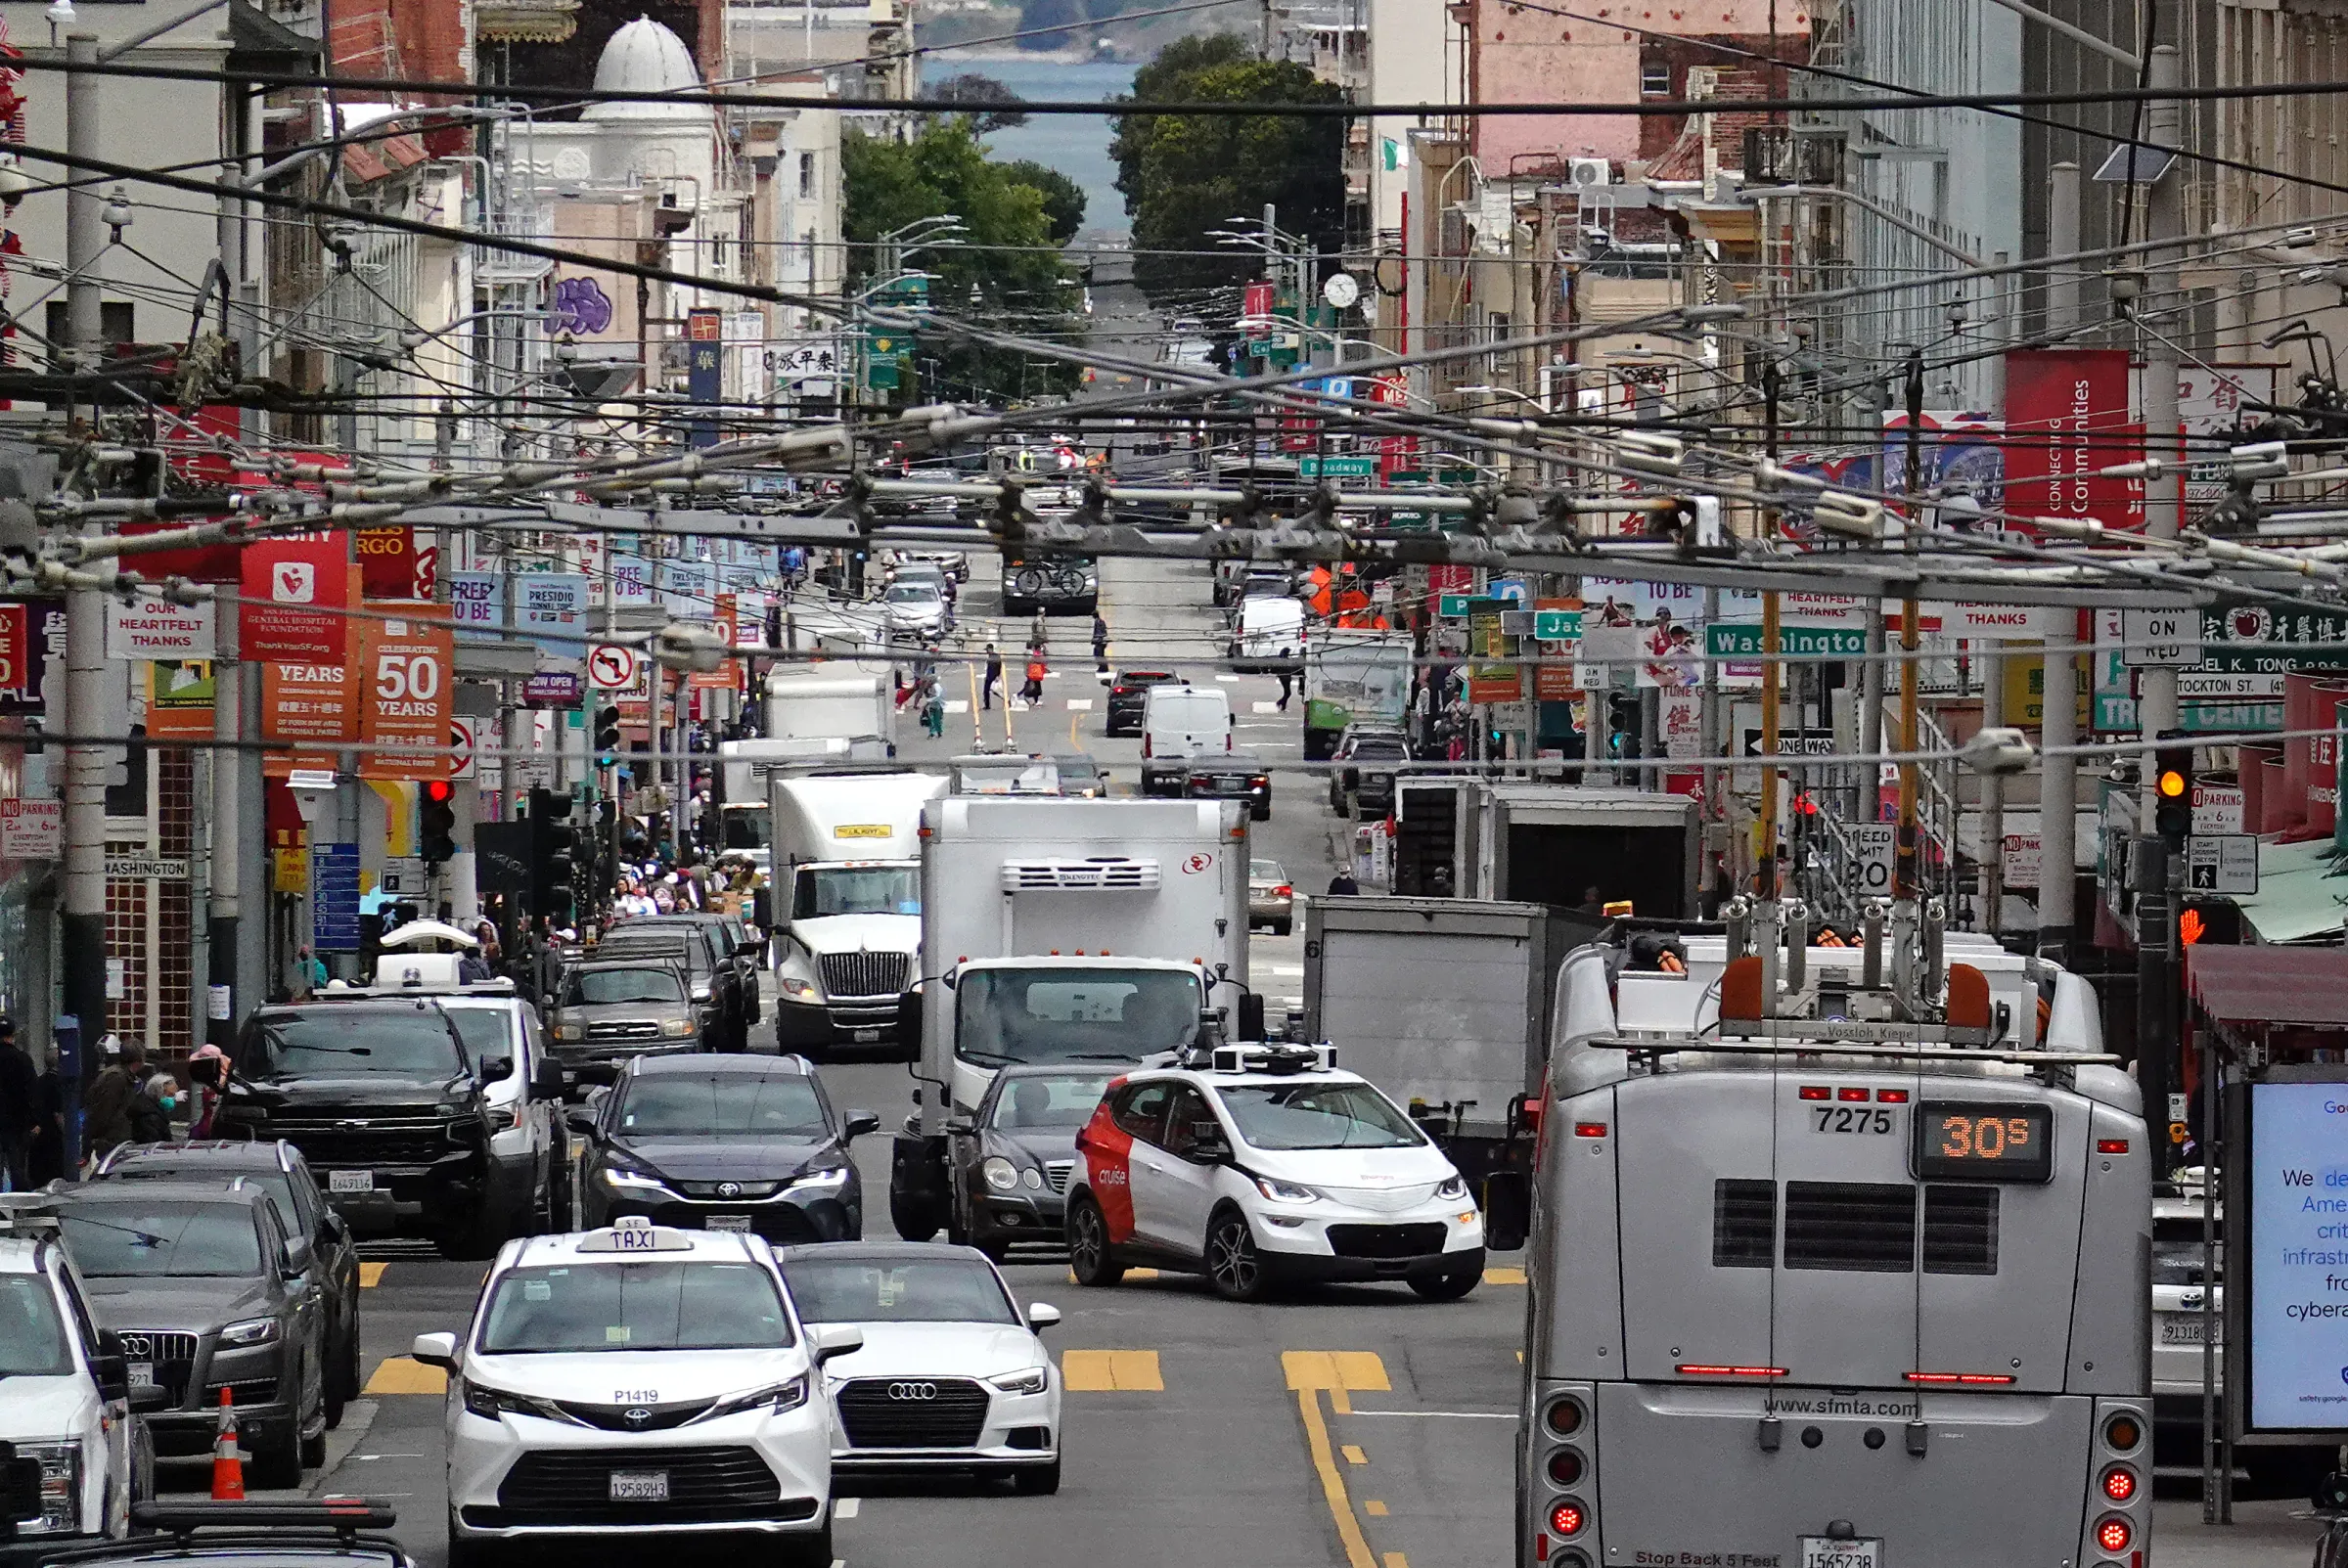
Within SF, surface street congestion is the bigger issue than freeway delay — the city has limited freeway miles. The US-101 through the city, I-80 approaching the Bay Bridge, and surface arterials like 19th Avenue and Van Ness Avenue carry heavy commuter volume. The Central Freeway (Octavia) approach is a consistent morning bottleneck. Parking-related cruising compounds surface congestion, particularly in SoMa and the Mission.
Peninsula (San Mateo to San Jose)
US-101 is the spine of the Peninsula and carries an enormous Silicon Valley tech commute. The Caltrain corridor parallels it but doesn't fully relieve freeway demand. The 101 between San Mateo and Palo Alto is among the most congested stretches in the Bay Area on weekday mornings northbound. I-280 offers a scenic alternative but fills up during the same windows.
East Bay (Oakland / Fremont)
The East Bay is the Bay Area's staging ground — most commuter traffic originates here and funnels toward the Bay Bridge or the Dumbarton/San Mateo bridges. I-880 from Fremont through Oakland is heavily loaded in both directions. The I-580 / I-205 interchange near Tracy is the effective eastern boundary of Bay Area congestion and backs up significantly during peaks.
Marin County
Marin's access to SF is almost entirely via the Golden Gate Bridge and US-101. The southbound approach in Sausalito backs up on weekday mornings, and the northbound approach from SF fills up in the evenings. Marin has no BART and limited transit alternatives, making its commuters particularly dependent on the bridge's capacity.
Best Times to Drive in the Bay Area
Forecast Traffic for Your Bay Area Commute
Enter your origin and destination to get a 7-day heatmap of drive times. See exactly which departure windows are fastest for your specific route — not just average Bay Area traffic.
route Analyze My RouteBay Area Traffic Patterns by Season & Event
☀️ Summer (June–August)
Traffic lightens moderately as tech and school commutes reduce volume. However, the Bay Area never fully clears in summer the way some cities do — enough workers maintain in-office schedules to keep peak windows busy. Weekend bridge traffic increases with beach and outdoor recreation trips.
📚 Fall (September–November)
Back to school and full workplace occupancy return simultaneously, making September the worst single month of the year for Bay Area traffic. The tech sector's hybrid schedules have reduced the sharpness of the peak slightly, but volume is still substantially higher than summer by mid-September.
🦃 Thanksgiving Week
The Wednesday before Thanksgiving is among the worst travel days in the Bay Area. I-80 east toward Sacramento and I-5 south toward LA are particularly congested. Within the metro, the traffic actually lightens slightly midweek as office commuters take time off — but highway traffic surges from travelers.
🎄 December Holidays
Traffic drops sharply from December 24 through January 1. The Bay Area's large tech sector takes extensive holiday shutdowns, producing some of the quietest freeway conditions of the year. January sees a sharp return to full volume, often making the first week of the new year feel dramatically worse than December.
⚾ Giants / A's Home Games
Giants games at Oracle Park affect the I-280, US-101, and Bay Bridge approaches from the south. Post-game traffic (typically 10–11 PM for evening games) backs up the 3rd Street corridor and nearby surface streets. Plan accordingly if you're driving the I-280 / 101 interchange area after a night game.
🏀 Warriors (Chase Center)
Chase Center in Mission Bay generates significant post-game traffic on the I-280 and nearby surface streets, compounding with existing congestion around SoMa. Arriving and departing via BART (16th Street Mission) or ferry is meaningfully faster for most game-goers.
Bay Area Traffic Research & Data Sources
For deeper dives into Bay Area traffic data, the following are the most reliable public sources and research institutions.
- Caltrans PeMS — Live and historical freeway sensor data across the Bay Area. pems.dot.ca.gov
- 511 SF Bay — Real-time traffic, incidents, and transit info for the Bay Area. 511.org
- MTC (Metropolitan Transportation Commission) — Regional transportation planning and open data. mtc.ca.gov
- Bay Bridge Traffic Counts — Caltrans Bay Bridge real-time and historical volume data. dot.ca.gov
- UC Berkeley SafeTREC (TIMS) — Collision and safety data for California roads including Bay Area. safetrec.berkeley.edu
- UC Berkeley Institute of Transportation Studies — Research on Bay Area congestion, emissions, and mobility. its.berkeley.edu
- SFCTA (SF County Transportation Authority) — Local travel demand modeling and corridor studies. sfcta.org
- Streetsblog SF — Detailed coverage of SF transportation policy, Vision Zero, and street safety. sf.streetsblog.org
- KQED Traffic — Bay Area traffic updates from KQED public radio. kqed.org
- Caltrans QuickMap — Real-time incident map for California freeways including Bay Area. quickmap.dot.ca.gov
More City Traffic Guides
Compare traffic patterns across other major US cities.